Canary Deployment in Kubernetes (Part 3) — Smart Canary Deployment using Argo Rollouts and Prometheus
Table of Contents
Canary Deployment in Kubernetes (Part 3) — Smart Canary Deployment using Argo Rollouts and Prometheus
Table of Contents
Deploying to production in Kubernetes can be quite stressful. Even after meaningful and reliable automated tests have successfully passed, there is still room for things to go wrong and lead to a nasty incident when pressing the final button.
Thankfully, Kubernetes is made to be resilient to this kind of scenario, and rolling back is a no-brainer. But still, rolling back means that, at least for some time, all of the users were negatively impacted by the faulty change…
What if we could smoke test our change in production before it actually hits real users? What if we could roll out a change incrementally to some users instead of all of them at once? What if we could detect a faulty deployment and roll it back automatically?
Well, that, my friend, is what Canary Deployment is all about!
Minimizing the impact on real users while deploying a risky change to production.
🎬 Hi there, I’m Jean!
In this 3 parts series, we’re going to explore several ways to do Canary Deployment in Kubernetes, and the first one is…
🥁
… using Argo Rollouts and Prometheus! 🎊
Before we start, make sure you have the following tools installed:
Note: for MacOS users or Linux users using Homebrew, simply run:
brew install kind kubectl argoproj/tap/kubectl-argo-rollouts helm k6
All set? Let’s go! 🏁
Kind is a tool for running local Kubernetes clusters using Docker container “nodes”. It was primarily designed for testing Kubernetes itself, but may be used for local development or CI.
I don’t expect you to have a demo project in handy, so I built one for you.
git clone https://github.com/jhandguy/canary-deployment.git
cd canary-deployment
Alright, let’s spin up our Kind cluster! 🚀
➜ kind create cluster --image kindest/node:v1.27.3 --config=kind/cluster.yaml
Creating cluster "kind" ...
 ✓ Ensuring node image (kindest/node:v1.27.3) 🖼
 ✓ Preparing nodes 📦
 ✓ Writing configuration 📜
 ✓ Starting control-plane 🕹️
 ✓ Installing CNI 🔌
 ✓ Installing StorageClass 💾
Set kubectl context to "kind-kind"
You can now use your cluster with:

kubectl cluster-info --context kind-kind

Have a question, bug, or feature request? Let us know! https://kind.sigs.k8s.io/#community 🙂
Argo Rollouts is a Kubernetes controller and set of CRDs which provide advanced deployment capabilities to Kubernetes such as blue-green, canary, canary analysis, experimentation, and progressive delivery.
In combination with Prometheus, Argo Rollouts can automatically roll back a Canary Deployment based on Prometheus metrics, which means it can theoretically handle an incremental rollout without human intervention.
If you haven’t already, go read Canary Deployment in Kubernetes (Part 1) — Simple Canary Deployment using Ingress NGINX and learn how to implement a Simple Canary Deployment using Ingress NGINX!
NGINX Ingress Controller is one of the many available Kubernetes Ingress Controllers, which acts as a load balancer and satisfies routing rules specified in Ingress resources, using the NGINX reverse proxy.
NGINX Ingress Controller can be installed via its Helm chart.
helm repo add ingress-nginx https://kubernetes.github.io/ingress-nginx
helm install ingress-nginx/ingress-nginx --name-template ingress-nginx --create-namespace -n ingress-nginx --values kind/ingress-nginx-values.yaml --version 4.8.3 --wait
Now, if everything goes according to plan, you should be able to see the ingress-nginx-controller Deployment running.
➜ kubectl get deploy -n ingress-nginx
NAME                       READY   UP-TO-DATE   AVAILABLE   AGE
ingress-nginx-controller   1/1     1            1           4m35s
If you haven’t already, go read Canary Deployment in Kubernetes (Part 2) — Automated Canary Deployment using Argo Rollouts and learn how to implement a Canary Deployment using Argo Rollouts!
Argo Rollouts can be installed via its Helm chart.
helm repo add argo https://argoproj.github.io/argo-helm
helm install argo/argo-rollouts --name-template argo-rollouts --create-namespace -n argo-rollouts --set dashboard.enabled=true --version 2.32.5 --wait
If all goes well, you should see two newly spawned Deployments with the READY state.
➜ kubectl get deploy -n argo-rollouts
NAME                      READY   UP-TO-DATE   AVAILABLE   AGE
argo-rollouts             1/1     1            1           13m
argo-rollouts-dashboard   1/1     1            1           13m
Prometheus can be installed via its community Helm chart, which also provides Grafana out of the box.
helm repo add prometheus-community https://prometheus-community.github.io/helm-charts
helm install prometheus-community/kube-prometheus-stack --name-template prometheus --create-namespace -n prometheus --version 54.2.2 --wait
If everything went fine, you should be able to see three newly spawned deployments with the READY state!
➜ kubectl get deploy -n prometheus
NAME                                  READY   UP-TO-DATE   AVAILABLE
prometheus-grafana                    1/1     1            1
prometheus-kube-prometheus-operator   1/1     1            1
prometheus-kube-state-metrics         1/1     1            1
In Part 2, we learned how to configure a Rollout and how to automate the Traffic Routing increments via Rollout steps.
Yet another amazing feature of Argo Rollouts is the ability to leverage Prometheus metrics in order to detect faulty deployments (i.e. based on request Success Share or Latency).
To this end, Argo Rollouts provides another Custom Resource called AnalysisTemplate.
Alright! Let’s explore what this is!
helm install sample-app/helm-charts/argo-rollouts --name-template sample-app --create-namespace -n sample-app --set prometheus.enabled=true --wait
If everything goes fine, you should eventually see one Rollout with the READY state.
➜ kubectl get rollout sample-app -n sample-app
NAME         DESIRED   CURRENT   UP-TO-DATE   AVAILABLE
sample-app   1         1         1            1
Alright, let’s have a look at the analysistemplate.yaml and the rollout.yaml inside the templates folder!
➜ ls -1 sample-app/helm-charts/argo-rollouts/templates
analysistemplate.yaml
canary
ingress.yaml
rollout.yaml
service.yaml
serviceaccount.yaml
servicemonitor.yaml
An AnalysisTemplate is a template spec that defines how to perform a canary analysis. It consists of a Prometheus metric which is being evaluated, at a given interval, against a given success condition.
In this example, the Prometheus metric is a Success Share, with a minimum threshold of 99% and an interval of 1 minute. The failure limit is 0, meaning that as soon as it fails, the Rollout will be aborted. Since it is the canary Deployment that we are trying to evaluate, the PromQL query must target it specifically via the service label.
---
apiVersion: argoproj.io/v1alpha1
kind: AnalysisTemplate
...
spec:
  metrics:
    - name: success-share
      interval: 1m
      successCondition: len(result) == 0 || result[0] >= 0.99
      failureLimit: 0
      provider:
        prometheus:
          address: {{ .Values.prometheus.address }}
          query: |
            sum(rate(
              sample_app_requests_count{service="{{ .Release.Name }}-canary", success="true"}[1m])
            ) by (service)
            /
            sum(rate(
              sample_app_requests_count{service="{{ .Release.Name }}-canary"}[1m])
            ) by (service)
            unless sum(rate(
              sample_app_requests_count{service="{{ .Release.Name }}-canary"}[1m])
            ) by (service) == 0
The instantiation of an AnalysisTemplate is called an AnalysisRun. It is like a Job, meaning it eventually completes, with a result of either Successful, Failed, or Inconclusive. If successful, the rollout continues, if failed, it is aborted and if inconclusive, it is paused.
There are two ways to define an AnalysisTemplate:
In our case, we will be using the Background Analysis, as it will detect a faulty deployment sooner than an Inline Analysis would.
---
apiVersion: argoproj.io/v1alpha1
kind: Rollout
...
spec:
  ...
  strategy:
    canary:
      ...
      steps:
        - setWeight: 25
        - pause: {}
        - setWeight: 50
        - pause:
            duration: 5m
        - setWeight: 75
        - pause:
            duration: 5m
      analysis:
        templates:
          - templateName: {{ .Release.Name }}
        startingStep: 2
      ...
  ...
As you can see, the Analysis has been scheduled to start after step 2.
Meaning, once the Rollout is promoted, the canary-weight will be set to 50 and an AnalysisRun will start. It will determine later if the Rollout succeeds or not: if the Prometheus metric falls below 99% Success Share, the Rollout will be aborted immediately. On the other hand, if the Success Share stays above 99% for 10 minutes, the Rollout will complete successfully.
Now that we’ve seen how an AnalysisRun works in theory, let’s see it in practice, shall we?! 🧐
kubectl argo rollouts dashboard -n argo-rollouts &
If you now head to http://localhost:3100/rollout/sample-app, you should see a shiny dashboard showing the state of the sample-app Rollout.
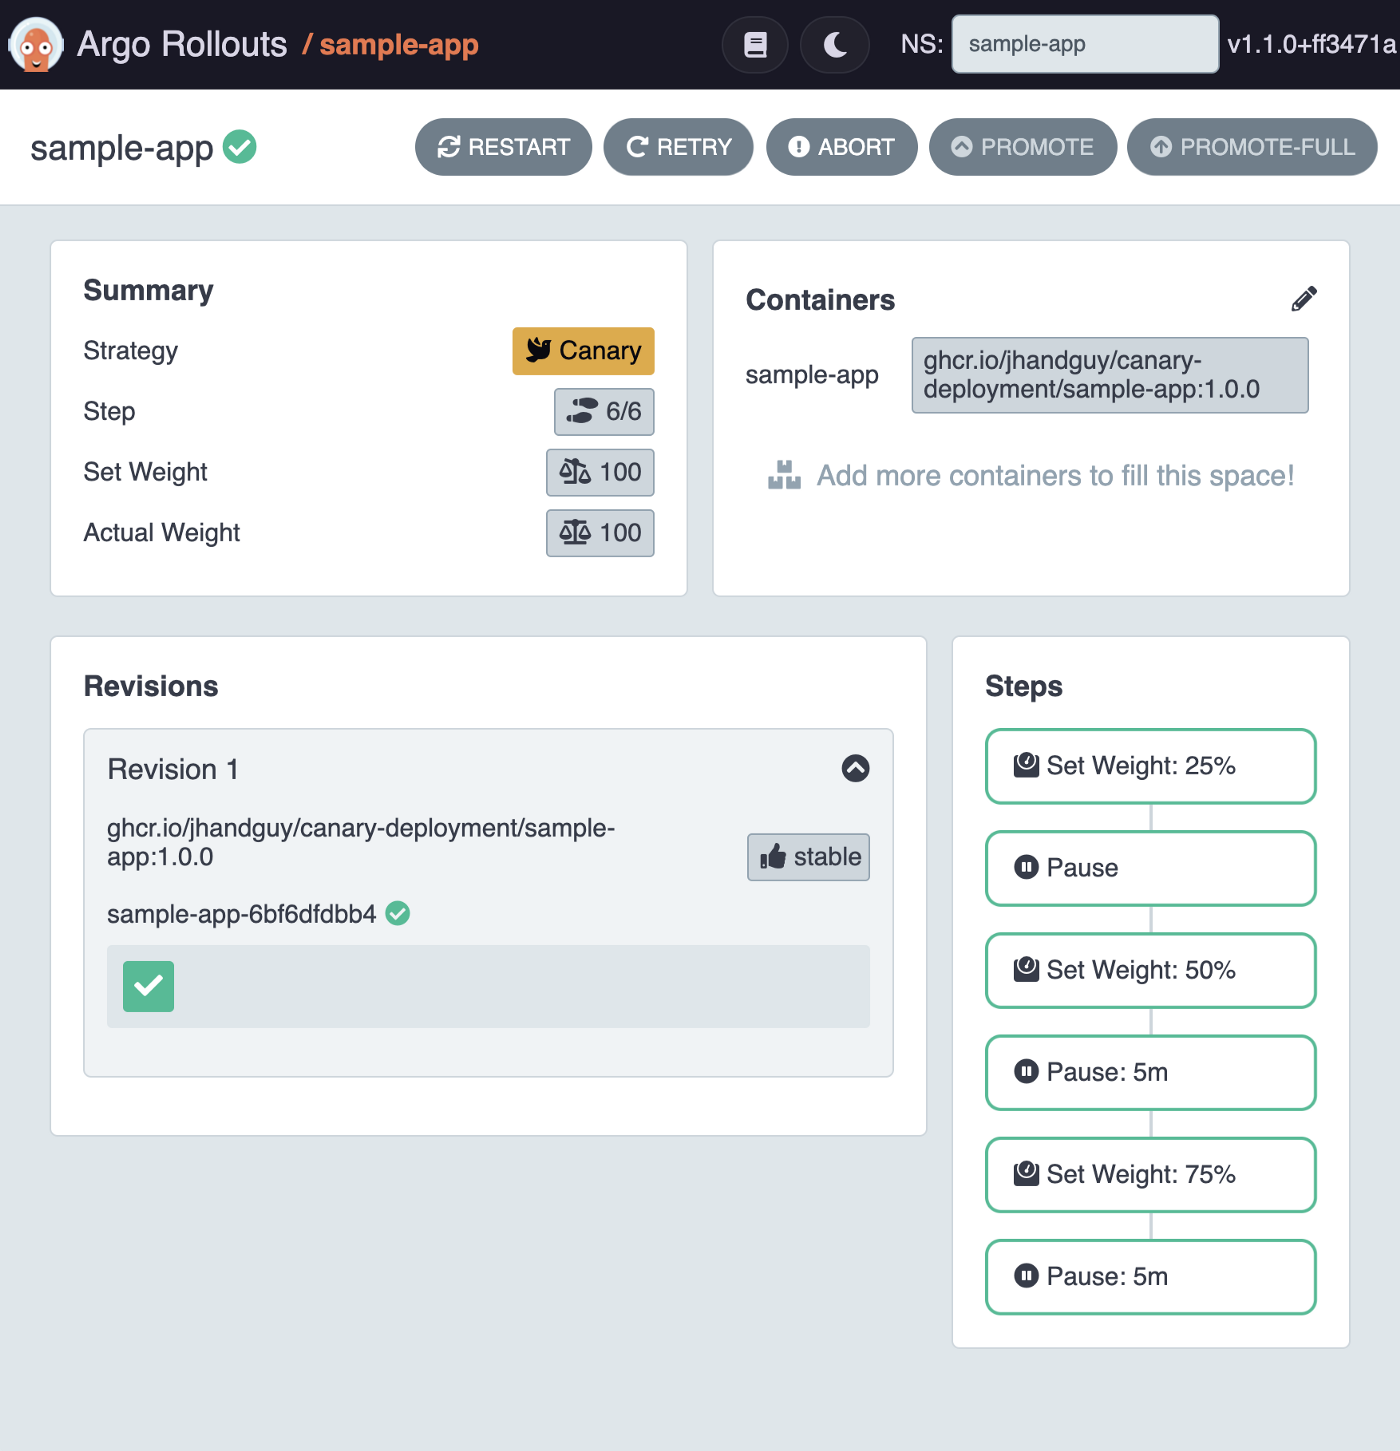
Cool! So far, we can observe only one revision labeled as stable, serving 100% of the traffic.
Now, let’s set a new image for the container!
kubectl argo rollouts set image sample-app sample-app=ghcr.io/jhandguy/canary-deployment/sample-app:latest -n sample-app
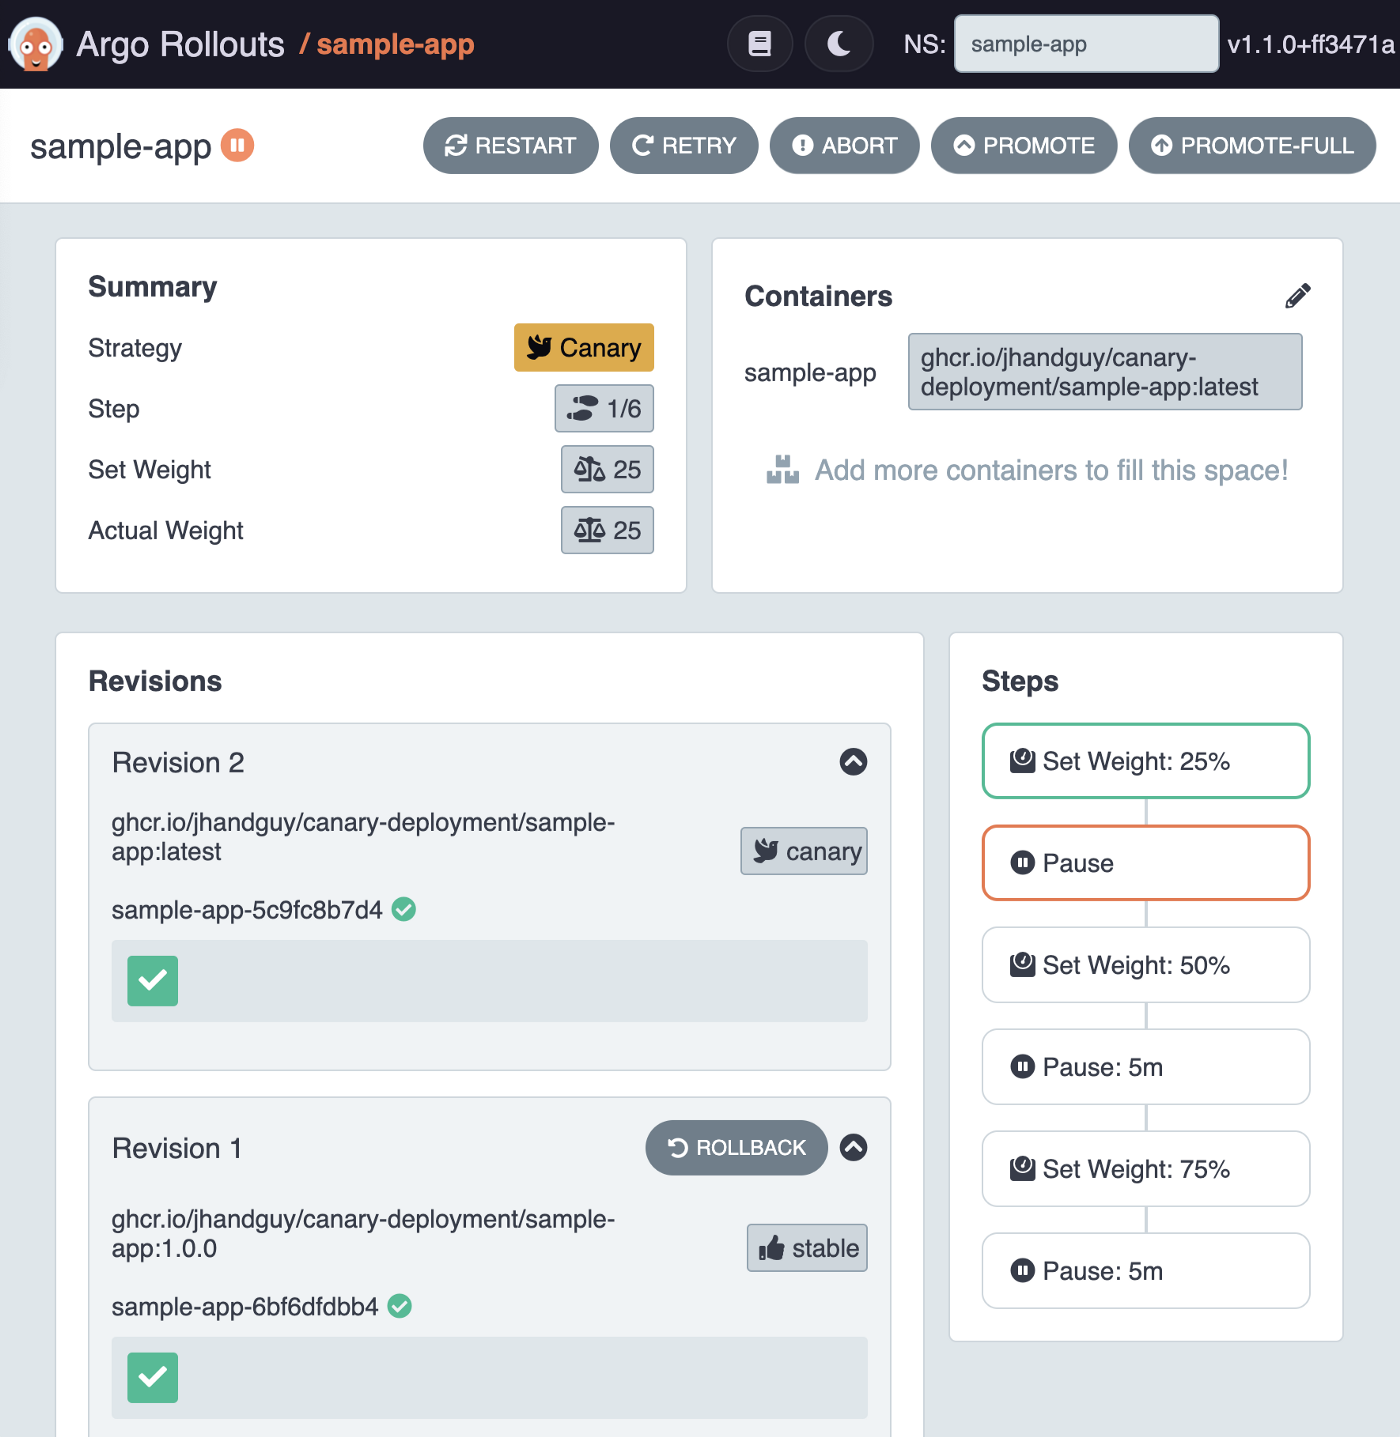
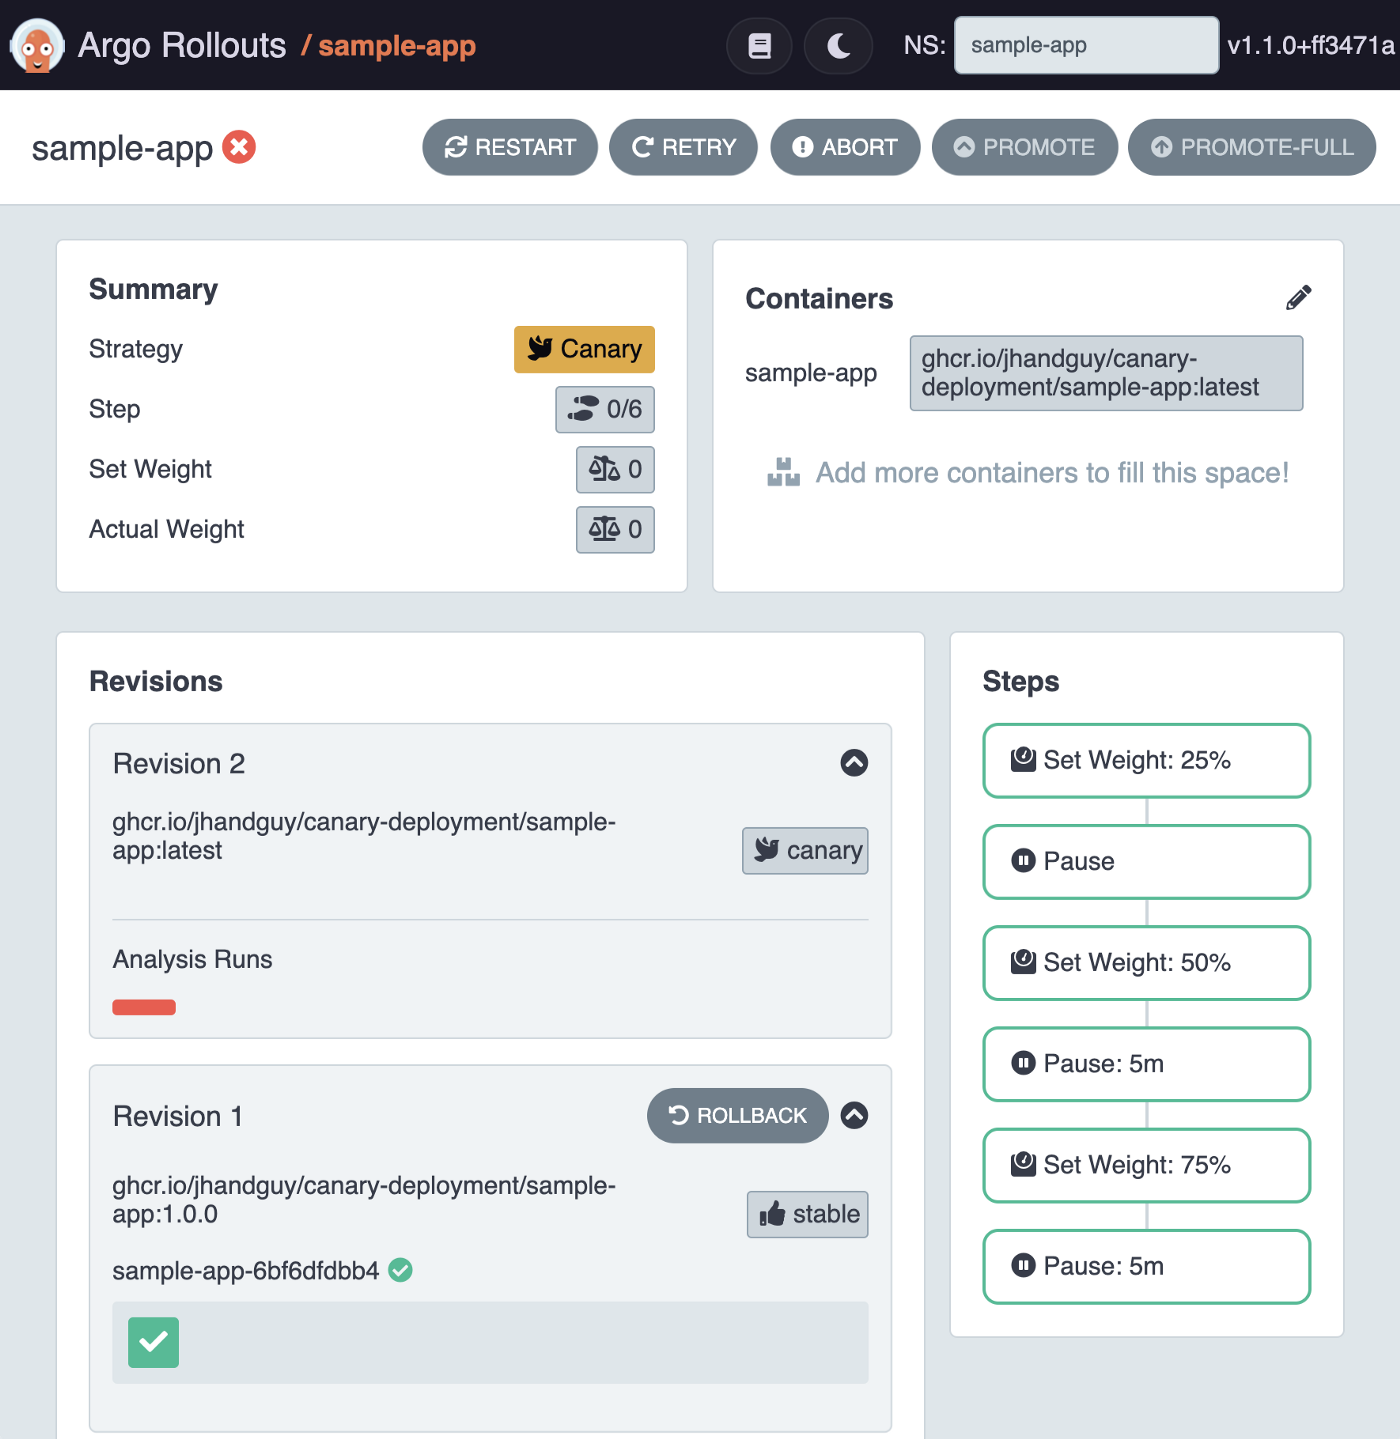
Tada! The Rollout has just completed step 1: setting the canary-weight to 25%.
As you can see, the AnalysisRun has not yet started, this will only happen once we start step 2. Let’s proceed then!
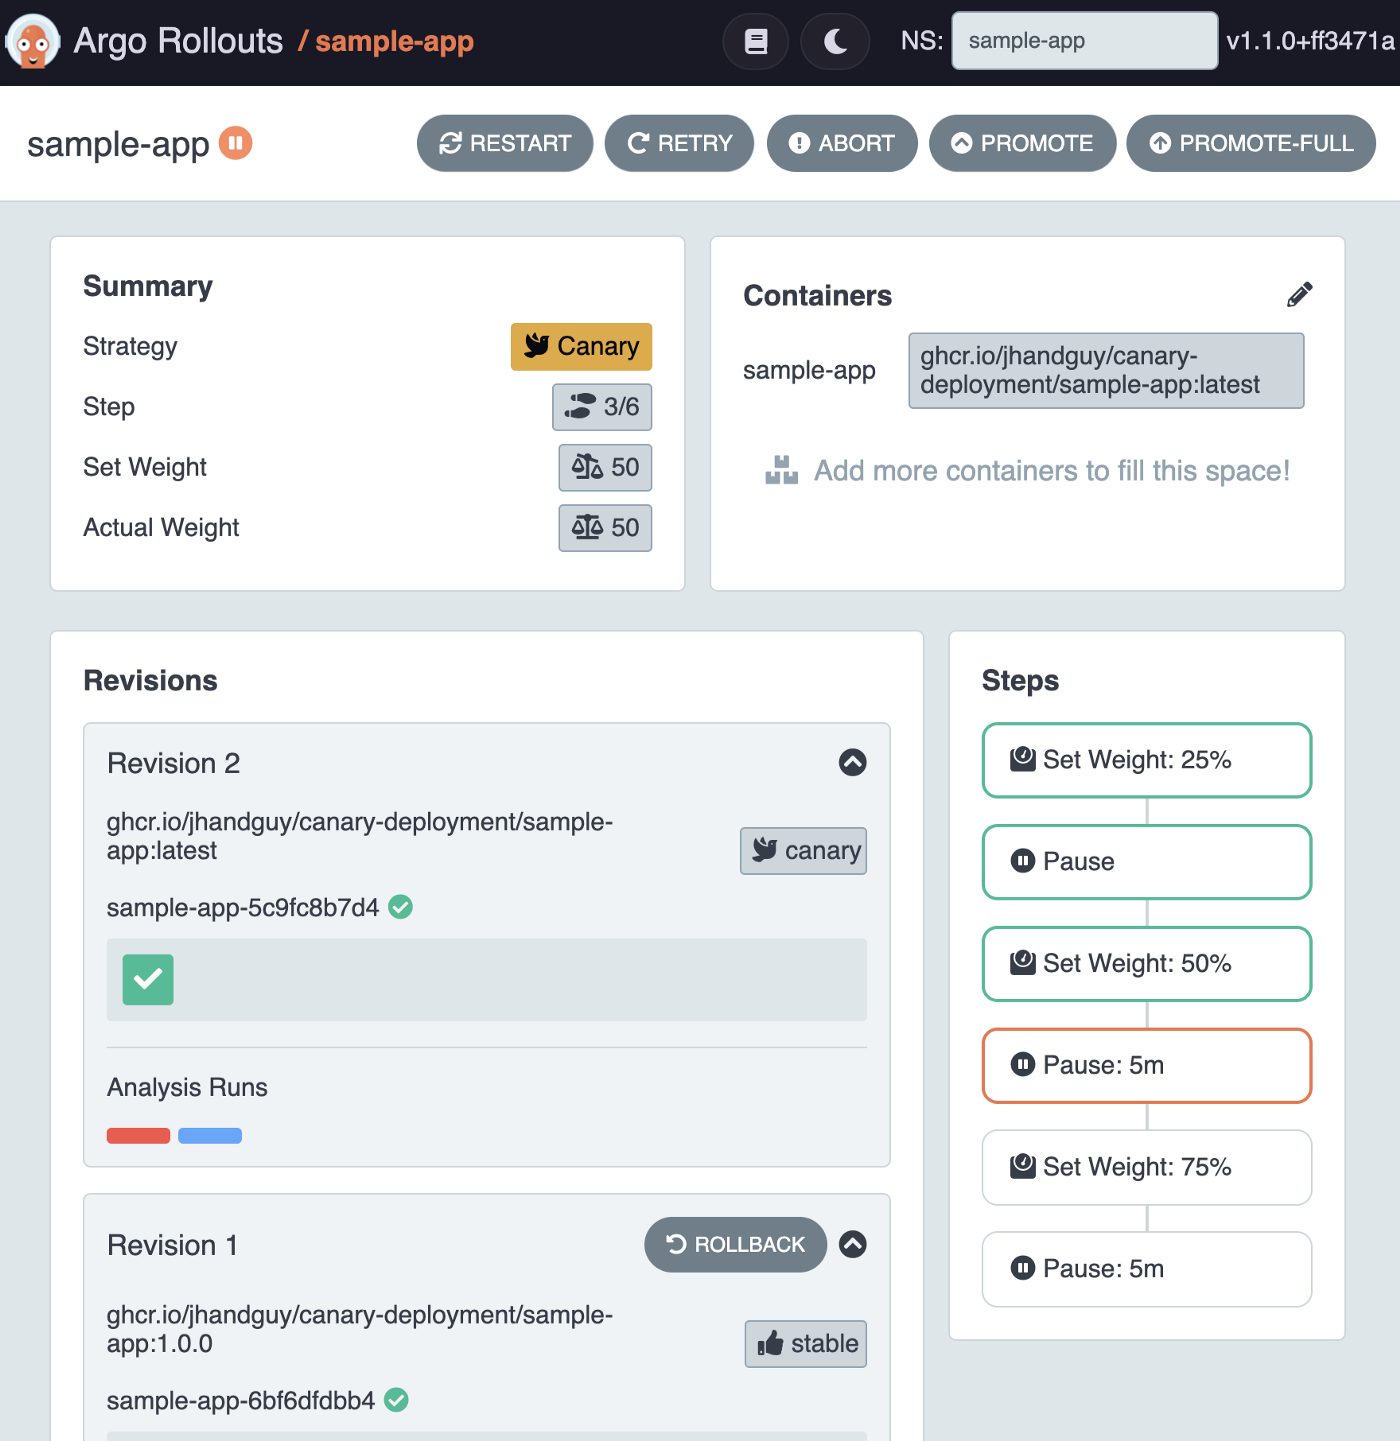
kubectl argo rollouts promote sample-app -n sample-app
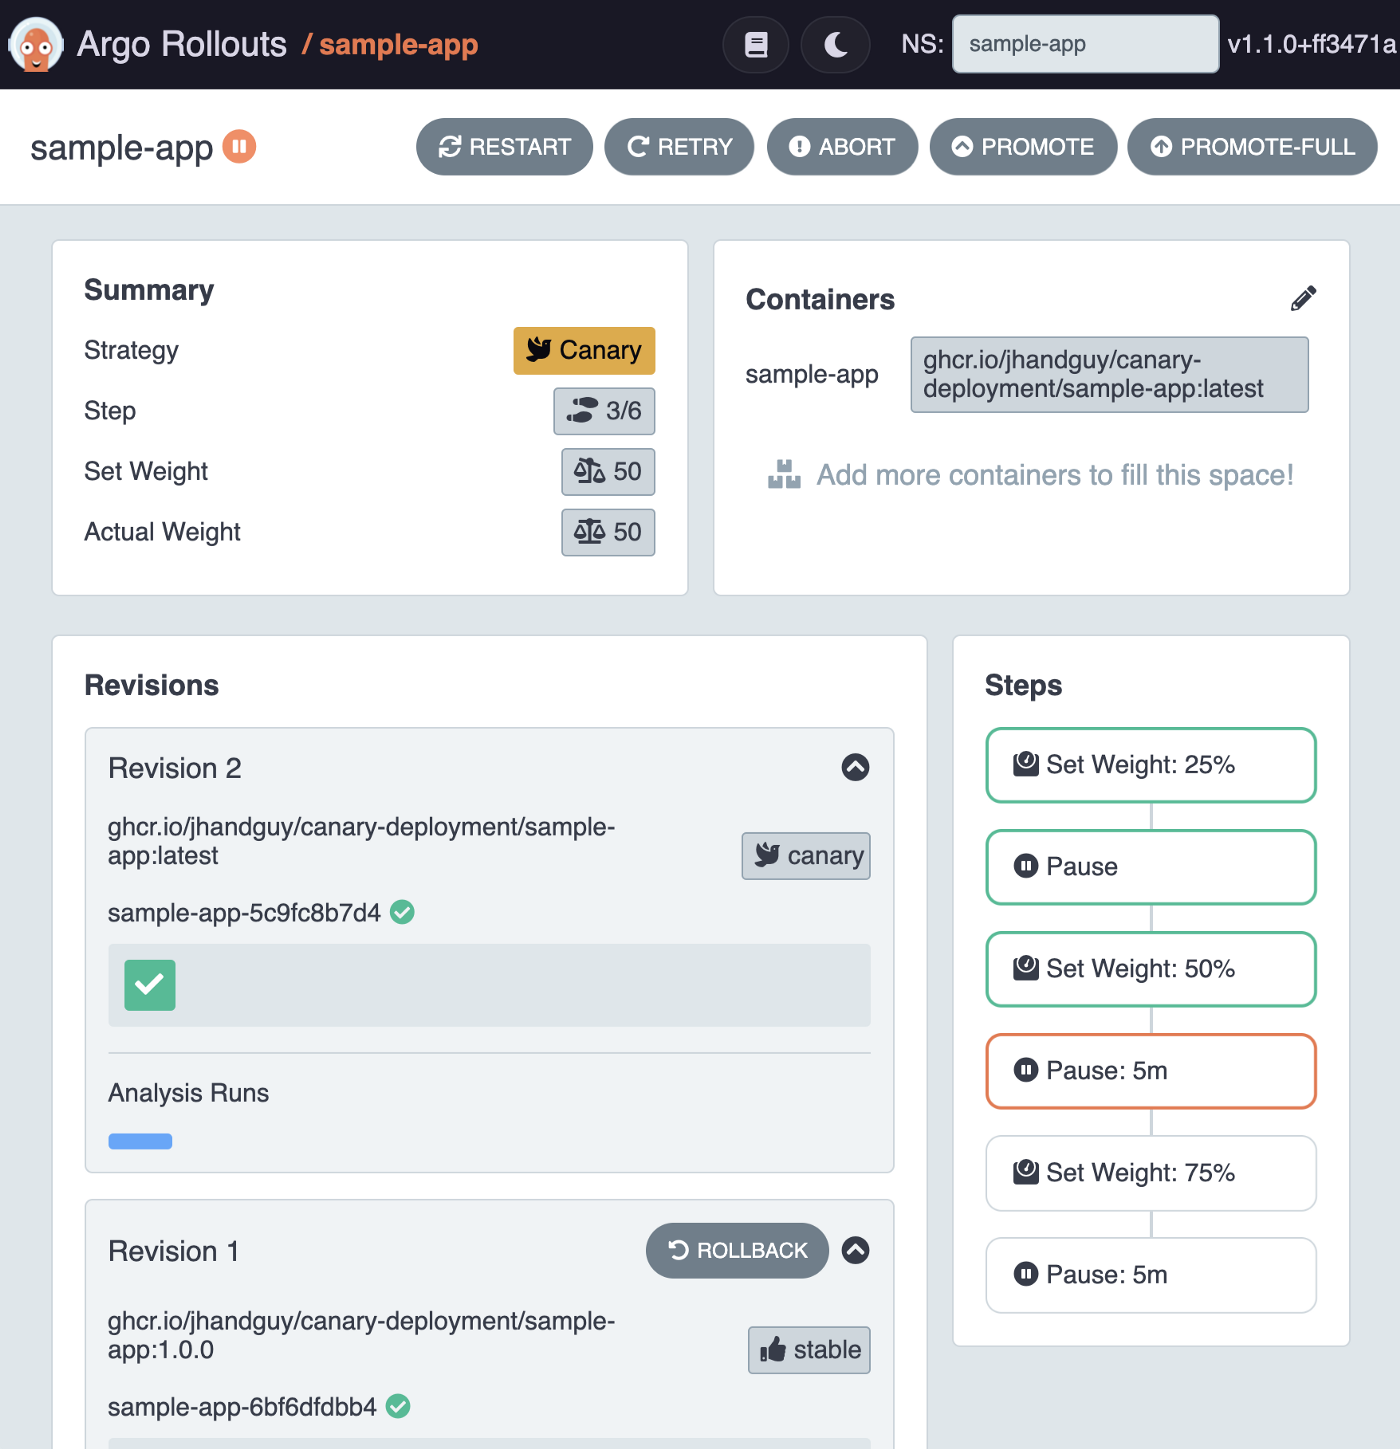
Awesome! The canary-weight is now at 50% and an AnalysisRun has just started.
➜ kubectl get analysisrun -n sample-app
NAME                      STATUS
sample-app-5c9fc8b7d4-2   Running
Let’s have a deeper look at it!
➜ kubectl describe analysisrun -n sample-app
Name:         sample-app-5c9fc8b7d4-2
Namespace:    sample-app
Labels:       rollout-type=Background
              rollouts-pod-template-hash=5c9fc8b7d4
Annotations:  rollout.argoproj.io/revision: 2
API Version:  argoproj.io/v1alpha1
Kind:         AnalysisRun
...
Spec:
  Metrics:
    Failure Limit:  0
    Interval:       1m
    Name:           success-share
    Provider:
      Prometheus:
        Address:  http://prometheus-operated.prometheus.svc.cluster.local:9090
        Query:    sum(rate(
                    sample_app_requests_count{service="sample-app-canary", success="true"}[1m])
                  ) by (service)
                  /
                  sum(rate(
                    sample_app_requests_count{service="sample-app-canary"}[1m])
                  ) by (service)
                  unless sum(rate(
                    sample_app_requests_count{service="sample-app-canary"}[1m])
                  ) by (service) == 0
    Success Condition:  len(result) == 0 || result[0] >= 0.99
Status:
  Metric Results:
    Count:  1
    Measurements:
      Finished At:  2022-01-29T18:37:49Z
      Phase:        Successful
      Started At:   2022-01-29T18:37:49Z
      Value:        []
    Name:           success-share
    Phase:          Running
    Successful:     1
  Phase:            Running
  Started At:       2022-01-29T18:37:49Z
Events:             <none>
As expected, the Spec part of the AnalysisRun is the same one we’ve specified in the AnalysisTemplate.
To monitor the progress of the Rollout, however, it is the Status and the Events that we will be looking at.
Right now, the measurement’s value is empty ([]), this is because the service has not recorded any metrics yet. Let’s change that and send some successful requests for Prometheus to scrape! 🚀
Since the PromQL query targets the canary Service specifically, we must make sure to always land in the canary Deployment using the Ingress
canary-by-headerannotation (learn more about it in Part 1).
curl localhost/success -H "Host: sample.app" -H "X-Canary: always"
After firing some requests and waiting about a minute for Prometheus to scrape the metrics and the AnalysisRun to measure the success-share metric, you should see one of the measurements with a value of [1], meaning that the Success Share has been successfully measured at 100%! 💯
➜ kubectl describe analysisrun -n sample-app
...
Status:
  Metric Results:
    Count:  5
    Measurements:
      ...
      Finished At:  2022-01-29T18:41:49Z
      Phase:        Successful
      Started At:   2022-01-29T18:41:49Z
      Value:        [1]
    Name:           success-share
    Phase:          Running
    Successful:     5
  Phase:            Running
  Started At:       2022-01-29T18:37:49Z
Events:             <none>
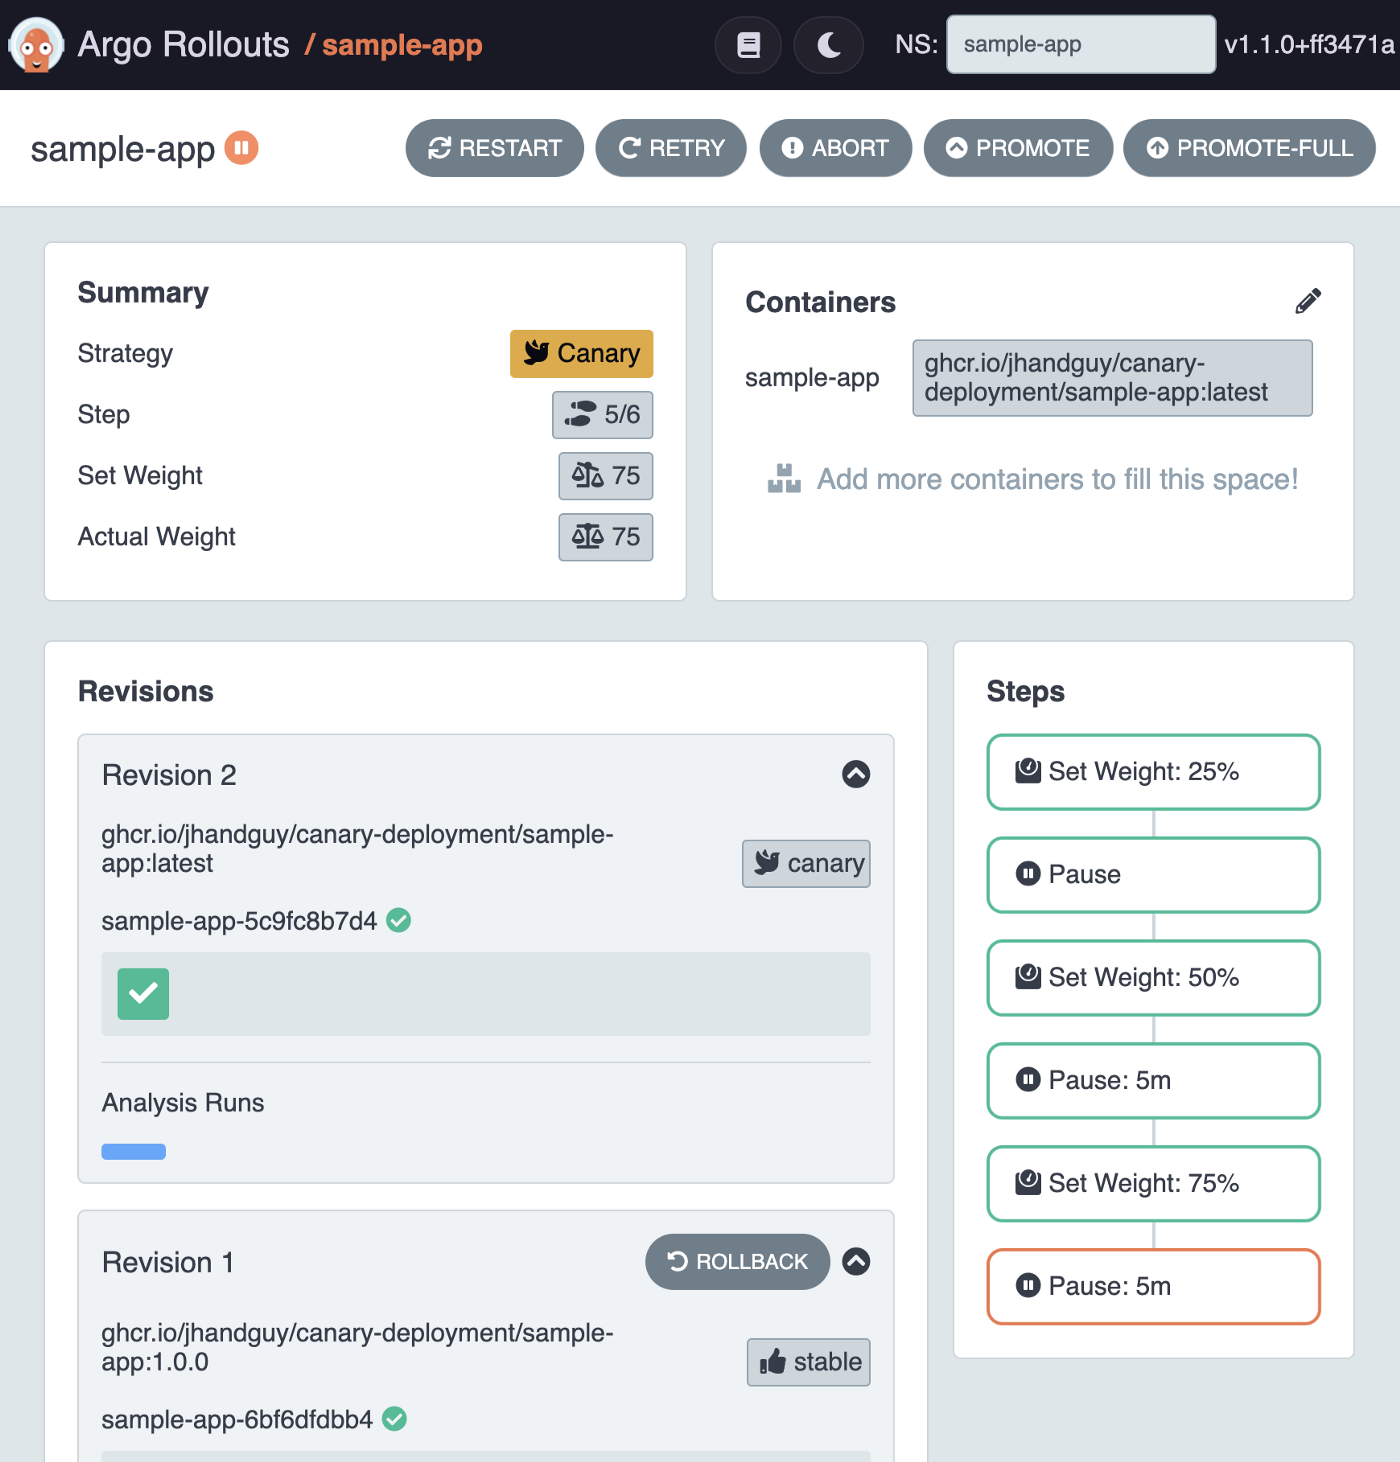
The best part of this is, that while all of this was happening, the Rollout kept on progressing and has probably already reached the next step: increasing the canary-weight to 75%.
That’s great! But let’s make things more interesting: what happens once the Success Share falls below 99%? 😱
Let’s go ahead and simulate a 50% Success Share by sending several requests and alternating between successes and errors!
curl localhost/success -H "Host: sample.app" -H "X-Canary: always"
curl localhost/error -H "Host: sample.app" -H "X-Canary: always"
After a short while, you should notice that something quite magical has happened… 🪄
➜ kubectl describe analysisrun -n sample-app
...
Status:
  Message:  metric "success-share" assessed Failed due to failed (1) > failureLimit (0)
  Metric Results:
    Count:   9
    Failed:  1
    Measurements:
      ...
      Finished At:  2022-01-29T18:45:49Z
      Phase:        Failed
      Started At:   2022-01-29T18:45:49Z
      Value:        [0.5]
    Name:           success-share
    Phase:          Failed
    Successful:     8
  Phase:            Failed
  Started At:       2022-01-29T18:37:49Z
Events:
  Type     Reason             Age   From                 Message
  ----     ------             ----  ----                 -------
  Warning  MetricFailed       17s   rollouts-controller  metric 'success-share' completed Failed
  Warning  AnalysisRunFailed  17s   rollouts-controller  analysis completed Failed
As soon as the AnalysisRun recorded a measurement breaching below the 99% Success Share threshold, the Rollout was immediately aborted.
Let’s confirm that from the Rollout’s status real quick!
➜ kubectl argo rollouts status sample-app -n sample-app
Degraded
Error: The rollout is in a degraded state with message: RolloutAborted: Rollout aborted update to revision 2: metric "success-share" assessed Failed due to failed (1) > failureLimit (0)
Indeed, even the Dashboard highlights that the Rollout is in a Degraded state, and consequently the canary-weight has been taken down to 0%.
This would, in practice, give us time to investigate the issue, and once fixed, retry the Rollout, either via the CLI or the Dashboard’s RETRY button.
kubectl argo rollouts retry rollout sample-app -n sample-app
kubectl argo rollouts promote sample-app -n sample-app
Now that the Rollout has restarted and reached step 2, a new AnalysisRun has started and the incremental rollout is back on track! 🛤
Instead of running some curl commands like we previously did, how about we execute a Load Test instead?
For Load Testing, I really recommend k6 from the Grafana Labs team. It is a dead-simple yet super powerful tool with very extensive documentation.
See for yourself!
k6 run k6/script.js
After about 1 minute, k6 should be done executing the load test and show you the results.
          /\      |‾‾| /‾‾/   /‾‾/
     /\  /  \     |  |/  /   /  /
    /  \/    \    |     (   /   ‾‾\
   /          \   |  |\  \ |  (‾)  |
  / __________ \  |__| \__\ \_____/ .io

  execution: local
     script: k6/script.js
     output: -

  scenarios: (100.00%) 1 scenario, 20 max VUs, 1m30s max duration (incl. graceful stop):
           * load: Up to 20.00 iterations/s for 1m0s over 2 stages (maxVUs: 20, gracefulStop: 30s)


     ✓ status code is 200
     ✓ node is kind-control-plane
     ✓ namespace is sample-app
     ✓ pod is sample-app-*
     ✓ deployment is stable or canary

   ✓ checks.........................: 100.00% ✓ 3095      ✗ 0
     data_received..................: 157 kB  2.6 kB/s
     data_sent......................: 71 kB   1.2 kB/s
     http_req_blocked...............: avg=41.24µs min=3µs    med=8µs    max=3.39ms  p(90)=19µs   p(95)=55.19µs
     http_req_connecting............: avg=21.96µs min=0s     med=0s     max=2.71ms  p(90)=0s     p(95)=0s
   ✓ http_req_duration..............: avg=3.75ms  min=940µs  med=2.96ms max=17.22ms p(90)=6.99ms p(95)=9.37ms
       { expected_response:true }...: avg=3.75ms  min=940µs  med=2.96ms max=17.22ms p(90)=6.99ms p(95)=9.37ms
     http_req_failed................: 0.00%   ✓ 0         ✗ 619
     http_req_rate..................: 50.00%  ✓ 619       ✗ 619
     ✓ { deployment:canary }........: 49.91%  ✓ 309       ✗ 310
     ✓ { deployment:stable }........: 50.08%  ✓ 310       ✗ 309
     http_req_receiving.............: avg=107.1µs min=24µs   med=88µs   max=2.09ms  p(90)=165µs  p(95)=189.09µs
     http_req_sending...............: avg=50.78µs min=14µs   med=36µs   max=837µs   p(90)=77µs   p(95)=114.19µs
     http_req_tls_handshaking.......: avg=0s      min=0s     med=0s     max=0s      p(90)=0s     p(95)=0s
     http_req_waiting...............: avg=3.6ms   min=857µs  med=2.78ms max=17.09ms p(90)=6.81ms p(95)=9.1ms
     http_reqs......................: 619     10.316653/s
     iteration_duration.............: avg=4.31ms  min=1.09ms med=3.53ms max=21.84ms p(90)=7.82ms p(95)=10.34ms
     iterations.....................: 619     10.316653/s
     vus............................: 0       min=0       max=0
     vus_max........................: 20      min=20      max=20


running (1m00.0s), 00/20 VUs, 619 complete and 0 interrupted iterations
load ✓ [======================================] 00/20 VUs  1m0s  00.71 iters/s
That sounds about right!
Depending on which step the Rollout is at, the Traffic Distribution shown in k6’s output should be either 50/50 or 75/25.
Same as before, if you now describe the AnalysisRun, you should see some successful measurements were measured.
➜ kubectl describe analysisrun -n sample-app
...
Status:
  Metric Results:
    Count:  5
    Measurements:
      ...
      Phase:        Successful
      Started At:   2022-01-30T14:34:07Z
      Value:        [1]
    Name:           success-share
    Phase:          Running
    Successful:     5
  Phase:            Running
  Started At:       2022-01-30T14:32:07Z
Events:             <none>
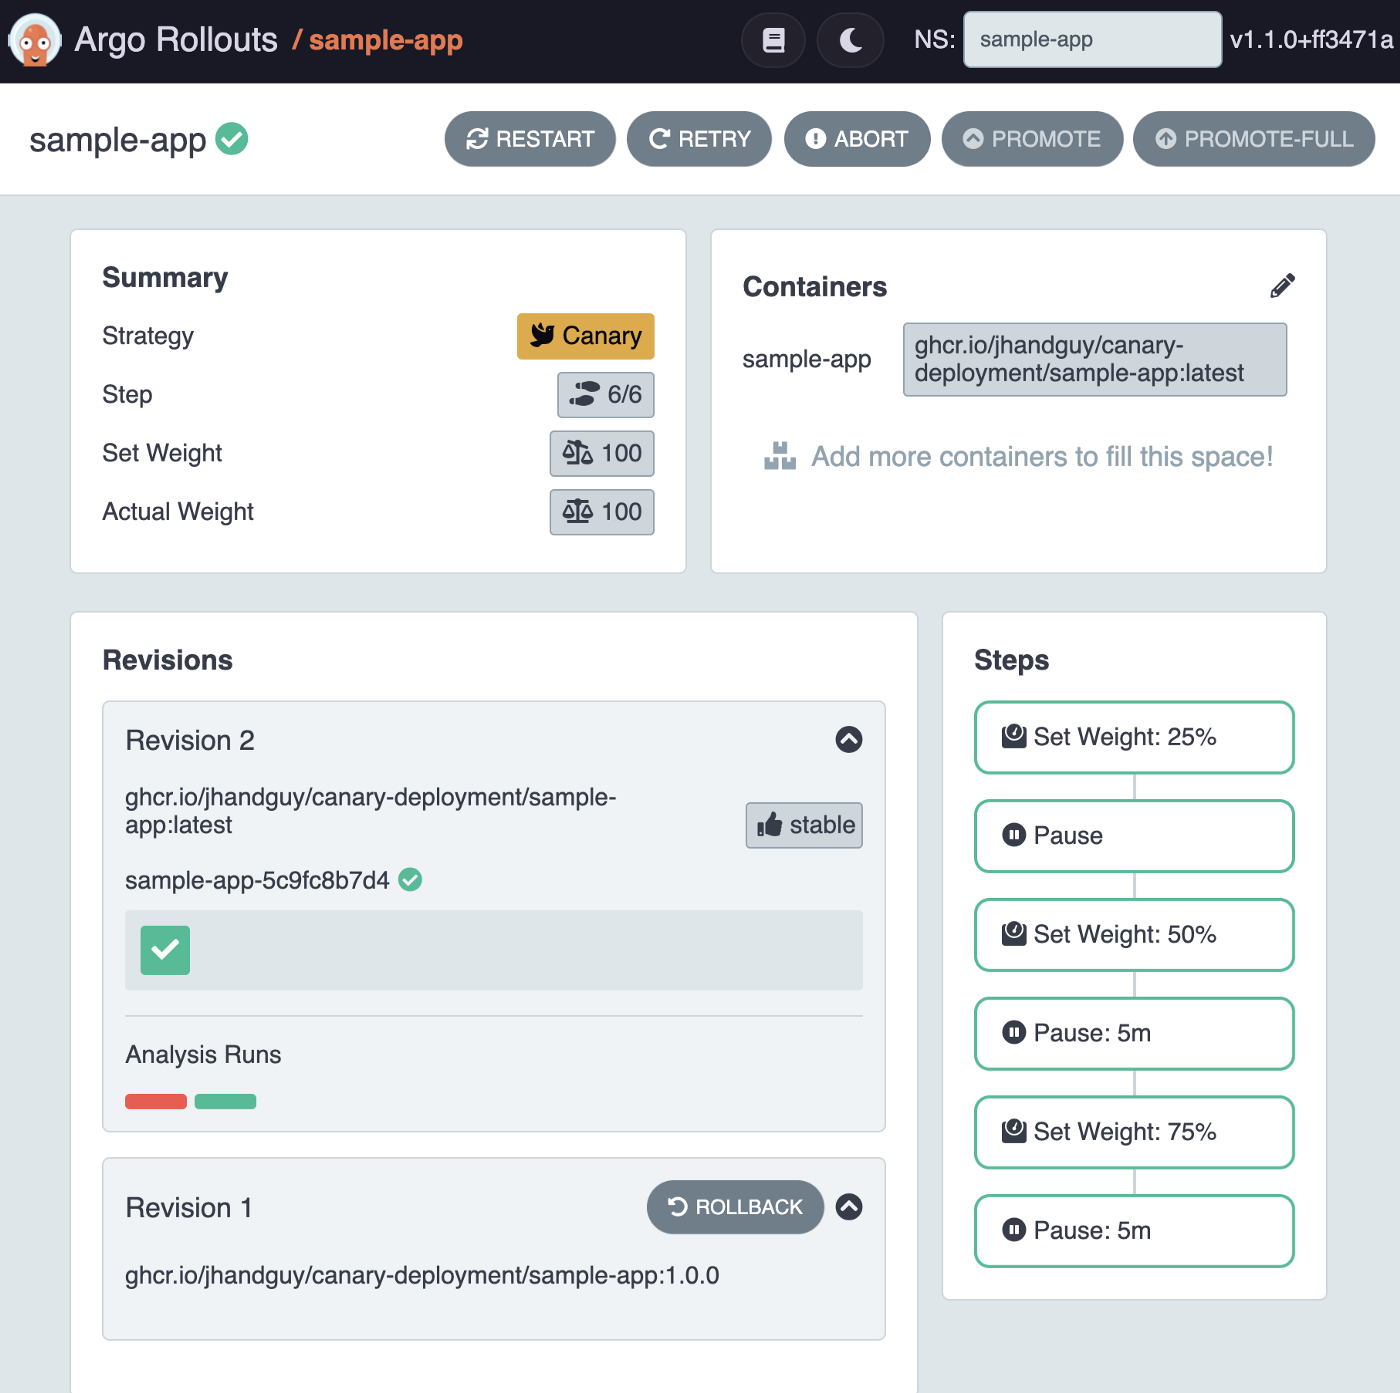
Eventually, the Rollout should complete successfully and the new revision should become the new stable Deployment! 🎉
That’s it! You can now delete your Kind cluster!
kind delete cluster
To summarize, using Argo Rollouts and Prometheus we were able to:
Was it worth it? Did that help you understand how to implement Canary Deployment in Kubernetes using Argo Rollouts and Prometheus?
If so, follow me on X, I’ll be happy to answer any of your questions and you’ll be the first one to know when a new article comes out! 👌
Bye-bye! 👋